NFL Receiving Yards Props: Target Share, Air Yards and the UK Punter’s Edge
 Available in US
The Tuesday a target-share spreadsheet changed how I bet receivers
For the first three seasons of my prop-betting life I built wide-receiver bets the way most punters do – recent receiving-yards average, opponent corner ranking, gut feel. The results were predictably mediocre. The shift came when I started tracking weekly target share alongside the air-yards data published by analytics shops. The first season I did this, my receiver-prop unit return moved from negative to positive without changing my stake size. Seven years on, target share is the first input I look at on a Saturday morning, and air yards is the second. Recent yardage averages have moved to the third tier of importance. I tell that story because it is the simplest available demonstration of how reordering inputs – not increasing volume – can flip a recreational prop strategy into a defensible one.
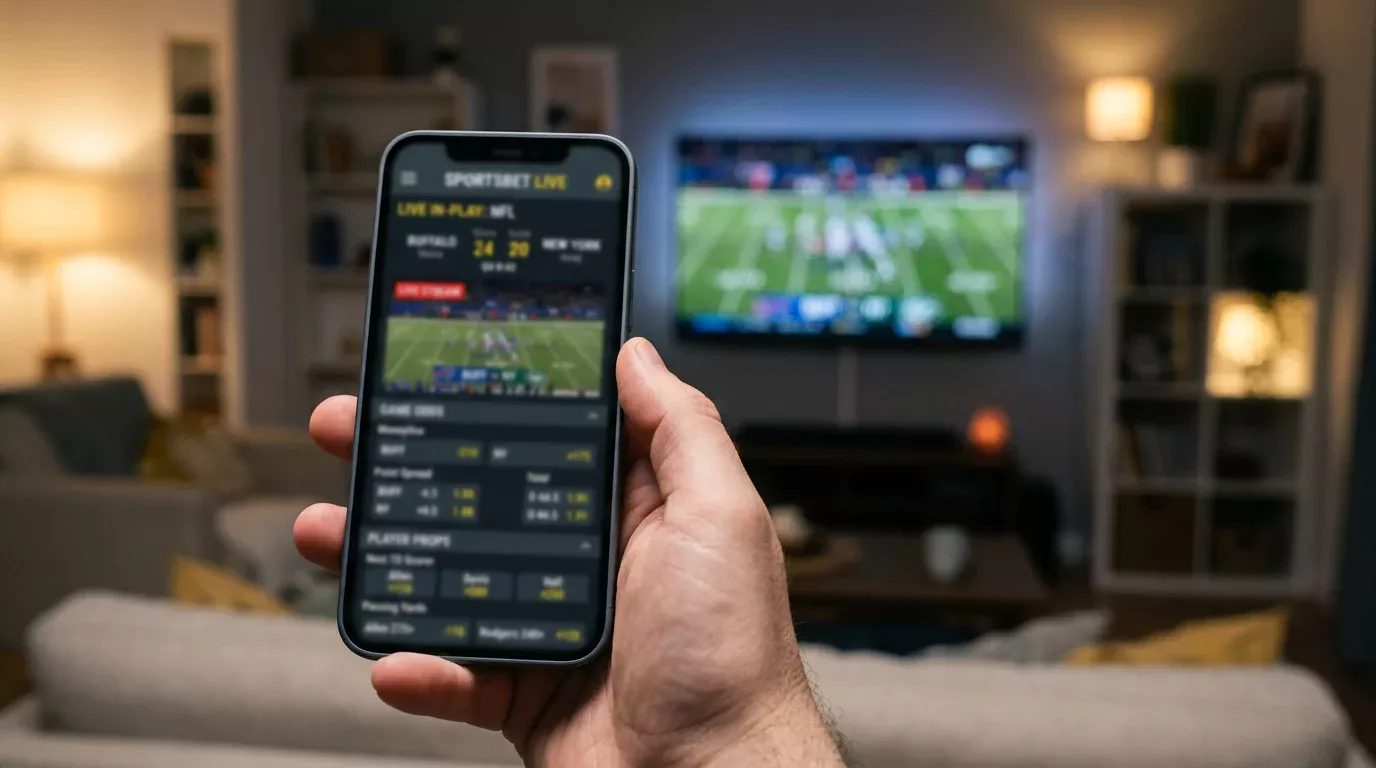
Optimove research shows that NFL bettors increasingly want personalised, real-time, mobile-first experiences, and prop markets are where that demand is most concentrated. As one industry director put it bluntly, this report is essentially a roadmap for bookmakers to win bettor loyalty during the NFL season – which means casual money is being aggressively chased exactly where it is, and the smart-money edge sits in inputs the casual money does not track.
Pair receiving with NFL rushing yards props for a complete offensive picture.
Target share as the core input
Target share is the percentage of a team’s total passing attempts directed at a specific receiver. If a quarterback throws 35 passes in a game and a receiver is the intended target on 9 of them, that receiver had a 26% target share. The metric is stable week-to-week for established alpha receivers, more volatile for secondary options, and a far stronger predictor of a receiver’s per-game yardage than yards-per-reception or recent yardage average.
The reason target share works is that it captures opportunity, not efficiency. A receiver with a 28% target share averaging 11 yards per reception will out-produce a receiver with a 16% target share averaging 14 yards per reception in the majority of games. Volume beats efficiency because the variance on per-target outcome is much higher than the variance on target volume.
Bookmakers know this. Their internal models incorporate target share heavily. The inefficiency is not in the bookmaker getting target share wrong; it is in casual punters anchoring on yardage averages and shifting the line’s juice in ways that leave value on the side of the receiver whose recent yardage looks pedestrian but whose target share has actually climbed.
Air yards and average depth of target
Air yards is the total downfield distance a receiver’s targets travel – every pass thrown his way, measured from the line of scrimmage to where the ball arrives. Average depth of target, or aDOT, is air yards divided by total targets. A deep-threat receiver might have an aDOT of 16 yards. A possession receiver might have an aDOT of 7. The two profiles bet differently.
Deep-threat receivers have higher variance week-to-week. One catch can make the over by itself. One coverage roll can hold them to 25 yards. Possession receivers have lower variance – they catch six short passes for 65 yards more or less every week. The bookmaker’s line is generally set higher for the deep threat to reflect upside, but the implied probability the line implies often understates the downside risk. Sharp money tends to lean to unders on hyped deep-threat receivers facing top coverage.
Shadow corners and how a top defender bends a line
The shadow-corner effect is real but often overstated. A top cover corner – the kind who travels with the opponent’s number-one receiver across formations – can reduce a target alpha’s receiving yards by 20 to 30 yards on average when the matchup is straight and direct. The catch is that elite alpha receivers are often moved around the formation specifically to avoid shadow coverage. The team strips out the lineup that would create a clean matchup.
The bookmaker’s line typically reflects the shadow-corner adjustment. A receiver line that opens at 84.5 yards against a top corner might be priced at 76.5 if the offence has shown a willingness to keep the alpha on the corner’s side. If the offence has shown a willingness to motion the alpha into the slot or away from the corner, the line will be closer to 81.5. UK punters who read the matchup carefully and identify the spots where the alpha will be schemed away from the shadow corner are taking the over at slightly too low a number. This connects to broader prop construction patterns covered in our piece on NFL touchdown scorer props and red-zone share, because the same offensive design that protects the alpha from shadow coverage also funnels his red-zone usage.
Slot versus outside receiver pricing
Slot receivers and outside receivers are priced differently because their target distributions differ. Slot receivers see shorter, more frequent targets – high catch rate, lower per-catch yardage. Outside receivers see deeper, less frequent targets – lower catch rate, higher per-catch yardage. The shape of the underlying distribution affects how the bookmaker prices the over and the under.
For slot receivers, the line tends to be more tightly anchored to recent averages, with less variance built into the juice. Slot receiver overs are slightly more profitable on hot streaks because the recency bias of casual money under-weights consistent volume. Outside receiver overs are slightly less profitable on hot streaks because casual money over-weights big-play receivers and shortens the over too aggressively.
Optimove insights show 60% of NFL bettors stake between £11 and £100 per wager, with prop markets accounting for a disproportionate share of those bets. The bias toward outside receivers in that volume is part of why slot-receiver overs offer cleaner pricing on average.
Explore nfl sports betting stats for all NFL yardage props.
A receiver-prop workflow that fits a UK Saturday afternoon
The workflow I run starts on Friday afternoon. I pull the previous four games of target share for every starting receiver on the slate. I cross-reference against the opponent’s slot-versus-outside coverage rankings. I identify the receivers whose target share is trending up while their yardage average is flat or trending down – that gap is where the bookmaker’s line tends to lag the underlying opportunity. Those are my over-bet candidates.
For underbets, I look for the inverse pattern: high recent yardage average driven by one big game, against a coverage matchup that suggests targets will be funnelled elsewhere. The line will be high because of the recent big game; the underlying opportunity will not justify it.
Sizing is the same discipline as elsewhere. No more than 1% of bankroll on any single receiver prop, with most positions at 0.5%. Variance is high enough that even well-priced bets resolve incorrectly often in the short term. The edge shows up across a season of twenty-five or thirty bets, not across any single Sunday. The structural inefficiencies in receiver-prop pricing are real, but they are not large enough to support large stake sizes on single picks.
Does target share or air yards matter more for NFL receiving-yards props?
Target share is the stronger primary input because it captures opportunity directly – how many passes are being thrown a receiver’s way. Air yards and average depth of target are useful secondary inputs that tell you about the shape of the receiver’s role, particularly for distinguishing deep threats from possession receivers. For most prop bets, target share gets you 70% of the way to a defensible read; air yards refines the remaining 30%.
How much does a shadow cornerback like Sauce Gardner cut a top WR’s prop?
A genuine shadow corner – one who travels with the alpha across formations – typically cuts the alpha’s receiving yards by 20-30 yards on average when the matchup is direct and uncomplicated. The bookmaker’s line generally reflects most of that adjustment. The residual edge lives in matchups where the offence is expected to motion the alpha out of the shadow coverage by aligning him in the slot or away from the corner.
Published by the nfl Sports Betting Stats team.