NFL Betting Math: Vig, Closing Line Value and Why 52.4% Is the Number That Matters
 Available in US
Table of Contents
- The bet that paid out and still lost me money
- What vig is and how the bookmaker actually sets it
- The 52.4% break-even rule
- Implied vs true probability
- Closing line value, defined cleanly
- How a UK punter should actually measure CLV
- Public betting splits: bets % vs handle %
- Sharps vs squares and how the line moves
- Parlay maths and the concentration of house edge
- Bankroll, edge thresholds and how to size NFL bets
- Frequently Asked Questions
The bet that paid out and still lost me money
The most useful losing bet of my career was a £20 winner. November 2019, Patriots-Cowboys, I’d taken the Pats −7 at 10/11 on a Tuesday night when the line opened. By Sunday kick-off the same spread had moved to −9 across the UK market. The Pats covered comfortably. I collected £38.18. And I spent the next month staring at a spreadsheet trying to understand why a winning bet had been mathematically inferior to leaving the money in the bank.
The answer was closing line value, vig, and a 52.4% break-even line I hadn’t internalised. I’d won the bet but bought the wrong price. The market had told me, in line-movement terms, that −7 was a discount and the closing −9 was the truer number. I’d cashed despite myself rather than because of myself. This article is the maths I wish I’d had on a single sheet seven years ago.
Calculate the edge with our NFL bookmaker hold percentage UK guide.
What vig is and how the bookmaker actually sets it
Vig — short for vigorish, also called juice or hold — is the bookmaker’s overround on a two-way market. It is the reason the average UK punter who picks 50% of NFL spread bets correctly still loses money over a season. Once you’ve understood it, you’ll never again read a fractional NFL price the same way.
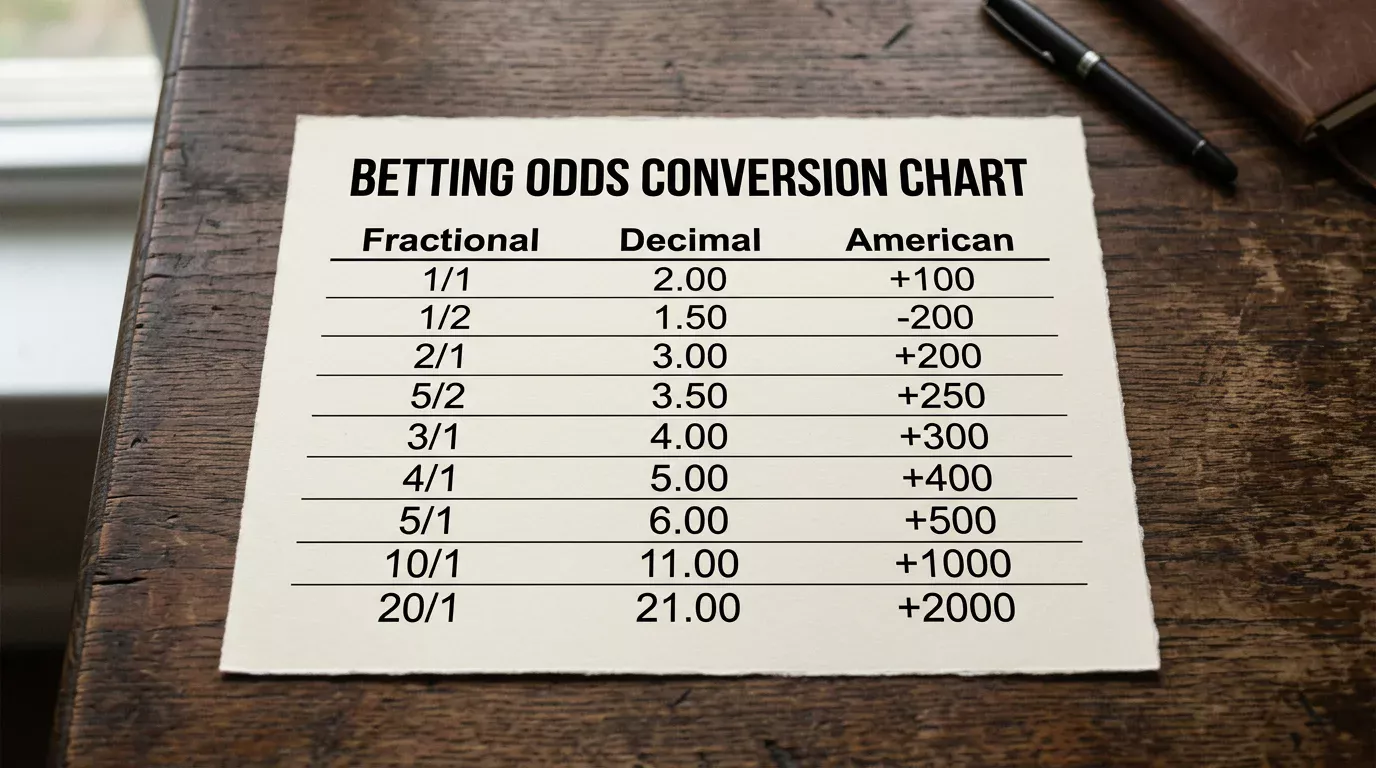
The standard NFL spread comes priced at −110 American on both sides, which converts to 10/11 fractional. The mechanics: stake £11 to win £10. If you bet £10 each on two sides of the same spread market — one wins, one loses — you stake a total of £20 and win back £19.09. The £0.91 you lost is the bookmaker’s hold across your two bets, equal to 4.55% of your handle.
That 4.55% is not a fee disclosed on your bet slip. It’s embedded in the price. Implied probability tells the same story in different units: 10/11 implies a 52.38% chance of winning. Add the implied probabilities of both sides of the spread — 52.38% on the favourite and 52.38% on the underdog — and the total comes to 104.76%. The 4.76 percentage points above 100% are the operator’s overround. In a fair market, the two implied probabilities would sum to exactly 100% with no vig. They never do.
The bookmaker tunes vig on three axes. Market liquidity: high-volume markets like the standard NFL point spread sit at the tight end, usually 104.5 to 105%. Markets with lower volume — alternate lines, exotic props, in-play micro bets — can be priced at 110% to 120% overround. Speed of settlement: live in-play bets typically carry 6 to 8% hold versus 4 to 5% pre-game. And risk profile: heavy-favourite moneylines often sit at slightly tighter overrounds than middle-ground moneylines because the operator’s exposure is more predictable.
If you only remember one piece of vig maths, make it this: vig is silent, it is constant, and it taxes every long-run bet you place. Your winning weeks pay it. Your losing weeks pay it. The only way to beat it is to find prices that imply a probability lower than the true probability — which is what every other concept in this article exists to help you do.
The 52.4% break-even rule
The single number every serious UK NFL bettor should be able to recall on demand is 52.38%, usually rounded to 52.4. That is the break-even hit rate at standard −110 (10/11) pricing — the percentage of spread bets you need to win just to come out flat on a long-run sample.
The arithmetic. Across two bets at −110 you stake £22 and win back £21 on average, losing £1 per £22 staked, or 4.55% of handle. To overcome that you need to win 11 out of every 21 bets, not 10 out of 20. 11/21 expressed as a decimal is 0.5238 — 52.38%. Anything below it loses money. Anything above it makes it.
The brutal part is how thin the difference is between losing slowly and winning at all. A punter at 50% accuracy loses 4.55% of handle every season. A punter at 52.4% breaks even. A punter at 55% earns roughly 5% return on handle. A punter at 57% earns 8.5%. The whole edge-finding industry — line-shopping, CLV tracking, model-building, contrarian betting, the lot — exists to push hit rates from the mid-50% range into the mid-to-high-50% range. Five percentage points of accuracy is the whole game.
BettingUSA’s most-cited public-betting figure is sobering: across the whole market, the public hits closer to 47 to 49% on NFL spreads, which means the average punter loses around 4.55% of total handle over time — basically the full vig, no more, no less. That number has been remarkably stable for a decade.
Two practical implications. First, line shopping matters enormously. If you can buy a spread at 4/5 (American +120 equivalent for the other side, reduced juice) instead of 10/11 on three games a week, you’ve reduced your break-even threshold from 52.4% to roughly 50.6%. That’s worth more than most “system” picks any tipster will sell you. Second, parlays and Bet Builders concentrate vig — they don’t dilute it. Four-leg same-game parlays at standard NFL pricing carry an effective hold of 12 to 18% depending on correlation. The maths gets worse with each added leg, not better.
Implied vs true probability
The whole game in betting maths is the gap between implied probability — what the bookmaker’s price says about the chance of an outcome — and your estimate of the true probability. A bet has positive expected value only when your estimate of true probability exceeds the implied probability built into the price.
An example. The Eagles are −3.5 favourites at 10/11. Implied probability of cover: 52.38%. If your model — based on whatever combination of stats, situational factors, weather and injury data you use — pegs the true probability of the Eagles covering at 55%, you have a 2.62 percentage-point edge. That sounds tiny. Across a season, it’s the difference between losing money and making it.
Most UK punters do this maths intuitively without ever writing it down. “I think the Eagles win by a touchdown” is a probability estimate dressed in plain English. The discipline that separates winning bettors from gut-feel ones is converting that intuition into a number — your honest probability of the bet landing — and comparing it directly to the implied probability of the price.
Two cautions. Your probability estimates are almost always more confident than they should be. The standard human bias is to over-credit your own analysis and under-credit market consensus. A useful gut-check: if your estimate of the Eagles’ cover probability exceeds the market’s implied price by more than 5 percentage points without strong information advantage, you’re probably wrong. The market sees what you see. If your number is materially different, ask why.
The second caution is that probabilities compound badly across parlays. If you genuinely have an edge of 2% per leg, a four-leg parlay does not give you an 8% edge. The correlations are nasty, the vig is concentrated, and most of your edge gets eaten before payout. Edge expresses itself most cleanly on straight bets.
Closing line value, defined cleanly
Closing line value, or CLV, is the most reliable single proxy for whether a punter has a long-term edge. It measures whether the price you took was better than the price at kick-off. If yes, you beat the market. If no, the market beat you — regardless of whether the bet itself won or lost.
The mechanic. You bet the Eagles −3.5 at 10/11 on Wednesday. By Sunday kick-off the same spread closes at −4.5 at 10/11 — meaning the market moved against your team by a full point. You took the better price. Your bet has positive CLV. If instead the line had closed at −2.5, the market moved toward your team and you should have waited. Negative CLV.
Why this matters: across a large enough sample, a punter who consistently beats the closing line will be in profit even if their hit rate is barely above 50%. A punter who consistently gets worse closing prices will lose money even if their hit rate is 55%. CLV is the truer signal because it captures the underlying skill of price-finding rather than the variance of game outcomes.
How much CLV are we talking about? Tracked across the analytical community, edge-positive NFL punters typically run between +0.5% and +2% CLV per bet on point spreads. A serious sharp might run +3% to +5%. Below the +0.5% threshold, the edge is statistically indistinguishable from variance, and any “profit” is mostly luck.
A common mistake. UK punters often confuse line movement in their favour with skill. If you bet the Eagles −3.5 and the line moves to −4.5, you didn’t necessarily “see” something — you might have just been first. Speed matters as much as judgement. The serious CLV question is: across one hundred bets, did your prices average better than the closing market? If yes, you have an edge that’s likely to persist. If not, the wins you’ve banked are variance.
For UK punters, fractional pricing complicates CLV tracking because the ticks the bookmakers offer are coarser than American odds. A move from 10/11 to 4/5 is a fractional jump that represents a roughly 6-cent move in American terms. A full deep-dive on calculating CLV from fractional UK prices, including the tick conversions and the data sources that actually work for tracking, sits in our piece on how to track closing line value as a UK NFL punter.
How a UK punter should actually measure CLV
The principle of CLV is simple. The practice of measuring it from a UK bookmaker’s app is where most punters give up. Operator apps don’t display the closing price next to your settled bet. You have to record it yourself or use a third-party tracker.
The lightweight method I use with mentees. A spreadsheet. Five columns: date, team and market, my price (fractional), closing price (fractional), and CLV in cents American — calculated by converting both prices to American odds, taking the difference, and recording whether it’s positive or negative. After 50 bets you have a statistically meaningful read on whether your prices, on average, are beating the close. Below 50 the data is too noisy to interpret.
The closing price needs to come from somewhere consistent. The kick-off snapshot from the same bookmaker you placed at is the cleanest comparable. The Pinnacle close — Pinnacle being the operator widely considered the sharpest pricing globally — is the gold standard for serious bettors, even though Pinnacle isn’t UK-licensed and you can’t actually bet there from Britain. Many UK punters split: bet at a UK bookmaker, track CLV against Pinnacle’s archived closes for diagnostic purposes only.
Pattern recognition kicks in after a season or two of data. You’ll notice you have positive CLV on certain market types — say, NFC East divisional spreads — and negative CLV on others. That’s actionable. Concentrate your handle where your CLV is positive. Cut or reduce bets in segments where your closing prices keep getting beaten by the market.
One discipline above all: track every bet, not just the winners. The winning bets you remember vividly are not representative of your overall edge. The bets you’d prefer to forget — the £20 you splashed on a coin-flip moneyline at 3am because you couldn’t sleep — count exactly the same in CLV terms as the carefully-modelled bet from Wednesday morning. The data only works if it’s complete.
Public betting splits: bets % vs handle %
The bets-percentage versus handle-percentage split is the cleanest publicly-available signal of where the smart money is going on an NFL game. Both numbers come from the bookmakers’ aggregated trading data, redistributed through public-data feeds that some UK and US apps surface in their pre-game tools.
The mechanic. Bets % is the share of total tickets on each side. Handle % is the share of total money on each side. When those two numbers diverge meaningfully, something interesting is happening. The classic case: 80% of bets are on the Cowboys, but only 35% of handle. That means a small number of bettors with large stakes are on the other side. The large stakes are usually sharp money. The 80% of small tickets are usually the public, betting the team they like.
Sharp action does not always win, but it wins meaningfully more often than the public does. Tracked across multiple NFL seasons, sharp-side handle has outperformed by 3 to 5 percentage points on the spread when measured against the closing line. That’s not a guarantee — it’s an edge of similar magnitude to a decent CLV signal.
How to read it in practice. If you see a heavy bets-% favourite that’s not getting the handle to match, treat the underdog more seriously than the spread suggests. If you see a bets-% and handle-% both heavily skewed one way, the move is consensus rather than sharp — less informational. The clearest contrarian signal is when bets % and handle % diverge wildly in opposite directions.
The under-35 demographic complicates the picture, incidentally. Sixty percent of US bettors aged 21 to 34 place three or more bets per week, well above the 47% average across the wider betting population, and their average stake of $58 is higher than the $49.50 overall mean. That’s a population that’s both more frequent and more confident, and they’re increasingly the noise the bets-% data is reading. Some splits services have started reporting bets % from “premium” or sharp-tier accounts only — those signals are tighter than the open market data, but harder to come by.
Sharps vs squares and how the line moves
Line movement is the bookmaker’s response to incoming money. When the trading desk sees lopsided action, they move the price. The question for a UK punter watching the line is whether the move was driven by sharp money or public money.
Sharp money typically arrives early. A line that opens Tuesday morning and moves significantly by Tuesday afternoon — before the public has even checked their app — is being moved by serious bettors with model-driven views. Public money typically arrives late: Saturday afternoon and Sunday morning, often heavily skewed toward favourites and overs. A line that moves further toward the favourite on Sunday morning has been bought by the public; a line that moves against the favourite despite the public being on it is responding to sharp action against the public.
The classic counter-signal is reverse line movement. The Cowboys are favoured by 6, 75% of bets are on them, and yet the line moves from −6 to −5. The public is on the Cowboys but the line is moving the other way. That’s the trading desk responding to a small number of large bets on the underdog. Reverse line movement is one of the more reliable predictors that the side getting the bigger handle — even if it’s not getting the bigger ticket count — has the edge.
The frequency-of-bet split shows up here too: punters who place three or more bets a week are slightly more likely to drive market-moving handle than those who bet sporadically. Higher-frequency bettors tend to have more rigorous bankroll discipline, more developed handicapping, and larger position sizes. They’re not all sharps. But the sharp population sits inside the high-frequency cohort.
Parlay maths and the concentration of house edge
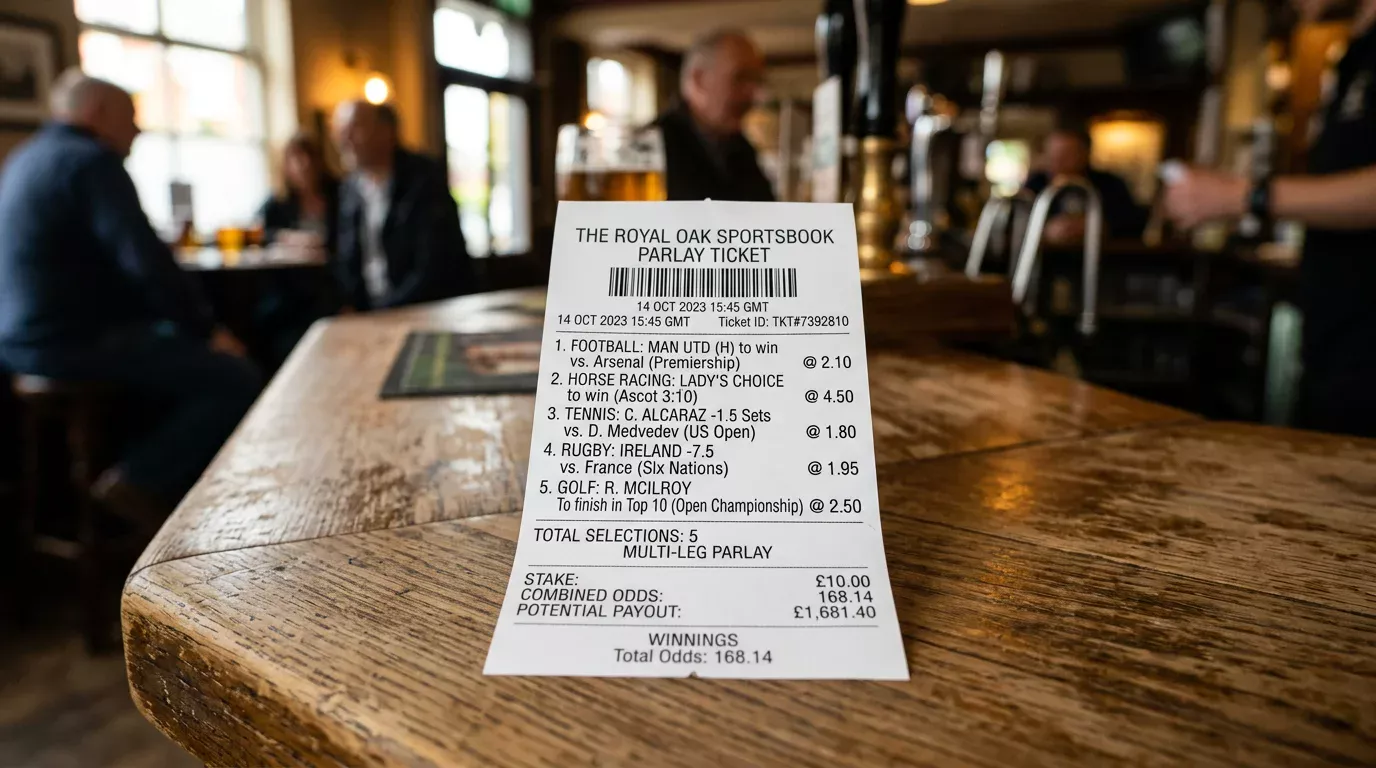
Parlays — what UK punters might call accumulators, what the industry now calls Bet Builders or same-game parlays when the legs come from a single fixture — are mathematically the bookmaker’s favourite product. The hold is higher, the variance is wider, and the punter’s perception of value is almost always inflated.
The maths. A two-leg parlay at standard −110 pricing has a true break-even hit rate of 56.4% on each leg, not 52.4%. A four-leg parlay needs a true 64.1% per leg to break even. A six-leg, around 70%. The compounding works against you because the operator’s overround compounds along with the legs. Same-game parlays make this worse: the bookmaker explicitly prices correlation, and the implied hold on a typical 4-leg NFL SGP runs 12 to 18%.
The participation data is stark. Among American bettors, parlay placement has more than doubled in the recent NFL era — 17% of bettors placed a parlay bet in 2018, climbing to 30% by 2024. Around 20 million American adults reported at least one problem gambling behaviour in the same period, a number that has fluctuated but stays in the millions. Those two trends are correlated. Parlays’ combination of small-stake-big-payout marketing and concentrated mathematical disadvantage attracts the cohort of bettors least equipped to absorb it.
This is not a moral statement. Parlays are entertainment products. A £2 ten-leg parlay paying £500 for a £2 stake offers genuine entertainment value, even at a 25% hold, because the alternative is paying £10 for a cinema ticket. The maths problem only matters when the stakes climb and the frequency rises. The 66% of NFL bettors who admitted in 2024 to betting more than they could afford — up from 45% the year before — disproportionately bet parlays. The product design feeds the behaviour.
Bankroll, edge thresholds and how to size NFL bets
The final piece of the maths is position sizing. Even with positive expected value on every bet, the wrong bet size relative to bankroll will bankrupt you. The right bet size, given your edge and your variance, is a calculation, not a gut feel.
The cleanest formula in serious bankroll management is the Kelly Criterion. Optimal bet size as a percentage of bankroll equals your edge divided by your odds (in net decimal terms). At standard NFL spread pricing, a punter with a 2% edge per bet should be sizing each spread bet at roughly 2% of their NFL bankroll. Many serious bettors use fractional Kelly — half-Kelly or quarter-Kelly — to absorb variance and reduce the risk of bankroll-destroying drawdowns.
Optimove’s Tomer Imber, looking at the broader NFL betting market, has argued that punters increasingly demand “personalised, real-time, mobile-first experiences” — but the demand for engagement should not extend to the bet size. Bigger bets do not equal bigger edges. They equal bigger variance. The discipline of stable position sizing across a season separates the punters who survive their bad weeks from the ones who chase.
Visit nfl sports betting stats for NFL mathematical analysis.
Frequently Asked Questions
Why is 52.4% the magic NFL hit-rate at standard −110 pricing?
At −110 (10/11 fractional) you stake 11 to win 10. Across two bets at that price, you stake 22 and win back 21 on average — a 4.55% loss on handle if you pick 50/50. To overcome the vig you need to win 11 out of every 21 bets, which is 52.38%, normally rounded to 52.4%. Below that you lose money. Above it you win. Five percentage points separates losing slowly from winning meaningfully.
What does a positive CLV trend tell me about my NFL betting edge?
A consistent positive closing line value pattern across a sample of 50+ bets is the cleanest available evidence that your price-finding has a genuine edge. The metric tells you that, on average, the prices you take are better than the prices the market settles on by kick-off. Positive CLV survives even short-term losing streaks — the edge is real and likely to persist. Negative CLV across a similar sample means your winning bets are variance, not skill.
What does reverse line movement on an NFL spread tell a punter?
Reverse line movement is when the line moves opposite to the public ticket count. The Cowboys are favoured by 6, 75% of tickets are on them, but the line moves to −5 instead of −7. That signals a small number of large bets on the underdog — typically sharp money. The side moving the line, not the side getting the tickets, is the side with the bigger handle and the more informed money. Reverse line movement is one of the more reliable contrarian signals available to a UK punter.
Why does the bets % vs handle % split signal sharp action on an NFL line?
Bets percentage measures the share of tickets on each side; handle percentage measures the share of total money. When those numbers diverge sharply — say, 80% of tickets on one side but only 35% of handle — it means a small number of bettors with large stakes are on the opposite side. Large stakes correlate strongly with sharp money. Tracking the divergence across a season can identify games where the public is heavily on one side but the smart money disagrees.
Published by the nfl Sports Betting Stats team.