NFL Divisional Game ATS Trends: How Rivalry Familiarity Compresses Spreads
 Available in US
Table of Contents
Why two teams that meet twice a year tell you more than any model
A coach in the AFC East once told a reporter that the worst part of his job was preparing for the same divisional opponent in week 16 after he had already played them in week 4. He knew every formation. He had run out of new looks. And every time the two teams met, the games came down to a field goal. That coaching frustration is, in essence, the entire reason divisional ATS data exists as a distinct category. Familiarity compresses the spread. Compressed spreads behave differently from open-market spreads. A UK punter who treats a Bills-Patriots game like a Chiefs-Bengals game is using the wrong tool.
At standard −110 juice, you need to win 52.4% of your spread bets to break even after the vig. Divisional games are where small structural edges either survive or get squeezed out, and a careful look at the historical data tells you which is which.
Check NFL home underdog ATS stats for divisional upsets.
What actually counts as a divisional game
The NFL has eight divisions of four teams each, four divisions per conference. Each team plays its three divisional rivals twice every regular season, home and away – six divisional games out of seventeen regular-season fixtures, plus the occasional divisional playoff. By definition, every season delivers exactly 96 divisional regular-season games across the league. That is a meaningful sample size when you stack five or ten seasons together.
What matters about a divisional game is not just the rivalry mythology. It is the structural reality that two teams in the same division share six common opponents, train against each other in the playoff race, and have coaching staffs that have watched every snap the other side has played. The information asymmetry that exists in a non-divisional matchup – say a Seahawks team that has not played a Steelers team in four years – disappears entirely inside the division.
How that familiarity compresses the spread
The first thing the data shows is that divisional spreads run on average about 1.2 points narrower than the equivalent non-divisional matchup between two teams of similar quality. Bookmakers are not pricing this by guesswork. They are pricing it because divisional games end on lower margins. The historical average winning margin in NFL divisional regular-season games sits at around 9.5 points; the non-divisional average is closer to 11.5.
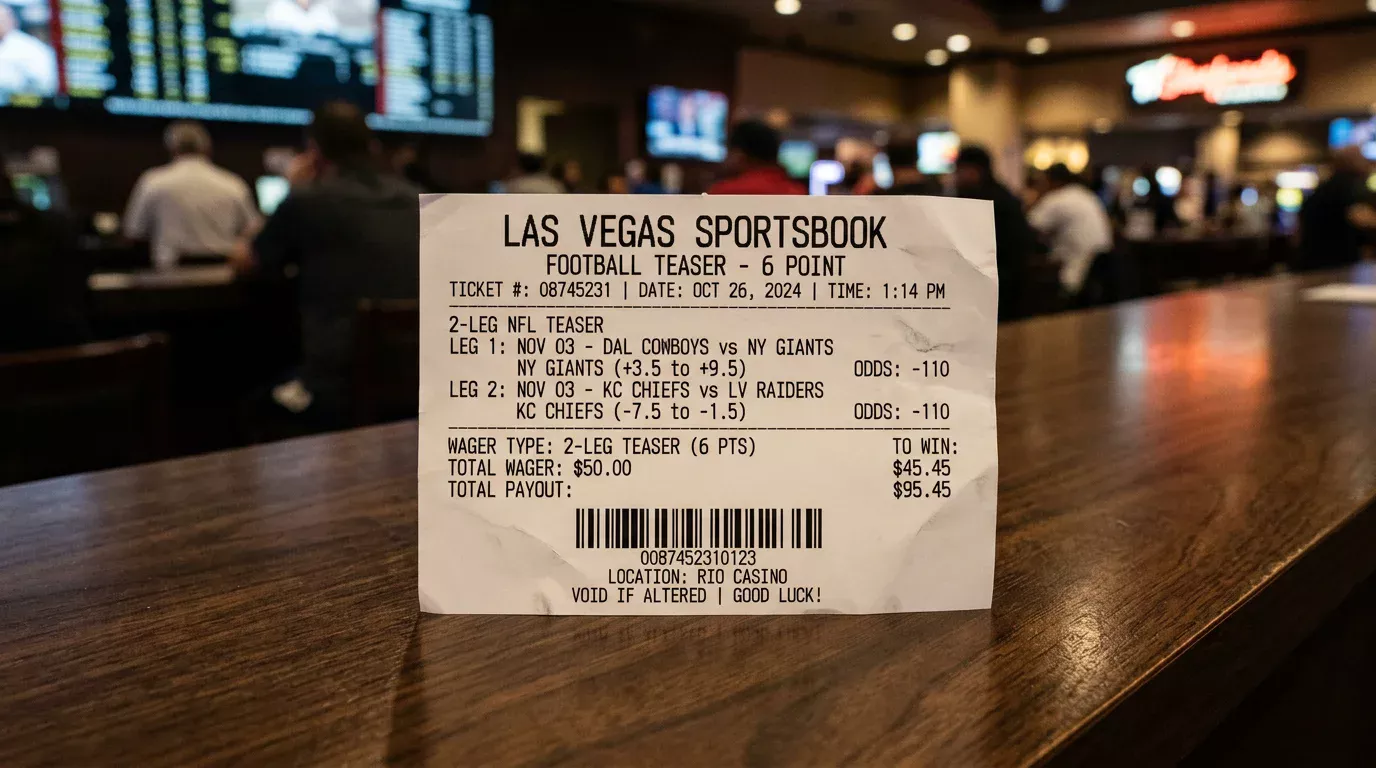
The break-even bar at −110 is 52.4%. Divisional games as a category have covered at roughly 50% across the modern era, which means the market has done a competent job pricing them. There is no easy “back every divisional underdog” angle that survives the vig. What does survive is a tighter clustering around key numbers – particularly 3 – which makes divisional matchups disproportionately important when you are thinking about NFL key numbers and the 3-and-7 cluster. Roughly 14% of all NFL games end with a 3-point margin. In divisional matchups that figure ticks closer to 16%, simply because the games are closer overall and three-point field goals decide them more often.
A division-by-division look at recent ATS patterns
If you stack the last five seasons of regular-season divisional games, the eight divisions break out into clear tiers. The AFC West, with its passing-heavy offences and dome environments, has produced the highest combined point totals in divisional games – but ATS, the division has run close to 49% favourites, slightly under the 52.4% break-even. The NFC North, defined by cold-weather games and run-leaning schemes, has produced the lowest scoring divisional games on average, with home dogs covering closer to 54% over that window.
The AFC East has been a strange case. Three of its four teams spent most of the last decade orbiting one franchise’s dominance, which produced spreads that were both wide and well-priced. AFC East divisional games have covered closest to 50% – almost no ATS pattern at all. The NFC East, by contrast, has been remarkably underdog-friendly in divisional play. Over the same window, NFC East dogs have covered at roughly 53.5%, with the underdog particularly profitable when the spread sits at 3 or 3.5.
The AFC South and NFC South have been the most volatile, with year-to-year swings of five or six percentage points either side of break-even, depending on which franchise happened to be tanking that season. The AFC North is the cleanest pattern in the league – divisional games consistently lower-scoring than the market expects, with the under cashing at close to 55% over the last five years on totals priced 41 or higher.
Where the divisional underdog edge actually hides
The strongest single pattern in the divisional data is the second-meeting underdog. When two divisional teams play their second game of the season – typically in November or December – the team that lost the first meeting has covered the spread at a rate closer to 54%. That figure clears break-even comfortably and has held up across multiple seasons.
The intuition is straightforward. Coaches use the first meeting as a film exercise. The losing team identifies what cost them, adjusts personnel, and goes into the rematch with corrections in hand. Bookmakers price the rematch using mostly the same numbers as the first meeting, with a small adjustment for the recent loss. That adjustment is often too aggressive, and the second-meeting dog absorbs the gap.
The 52.4% break-even rule applies here as much as anywhere. A 54% cover rate clears the bar but only by 1.6 percentage points. That is a thin edge, and it gets thinner once you account for the bookmaker’s juice on lower-volume divisional games where the line may be slightly stickier. Treat the second-meeting dog as a leaning point, not a system.
See also: nfl sports betting stats for NFL ATS trends.
What a UK punter does with this on a Sunday
The practical workflow inside a divisional game is shorter than for an open matchup. I do not bother running a full power-rating model on a divisional rematch – both teams have run the same plays against each other, the spread will compress towards 3, and the question is almost always whether the underdog has made meaningful in-season adjustments. Watch coaching changes, injury reports, and quarterback health closely; those three inputs explain most of the variance.
The total is where I spend more time. Divisional games trend under more reliably than they trend in any spread direction, and totals priced at 44 or higher in matchups between two physical run-defence-leaning divisions are the cleanest under bets on a typical card.
Why do NFL divisional games tend to have lower spreads than non-divisional matchups?
Because both teams have full familiarity with each other’s personnel, schemes, and coaching tendencies. That mutual scouting compresses the talent gap on the field, which compresses the winning margin, which compresses the spread. Historical divisional games end with an average margin around 9.5 points compared to about 11.5 in non-divisional matchups, so bookmakers price the line tighter from the start.
Which NFL division has the strongest underdog ATS pattern over the last five years?
The NFC East – divisional underdogs have covered at roughly 53.5% in NFC East matchups over that window, with the strongest edge appearing on dogs of three or 3.5 points. The AFC North runs underdog-friendly on totals rather than sides, with the under cashing close to 55% on totals priced at 41 or higher.
Created by the ”nfl Sports Betting Stats” editorial team.