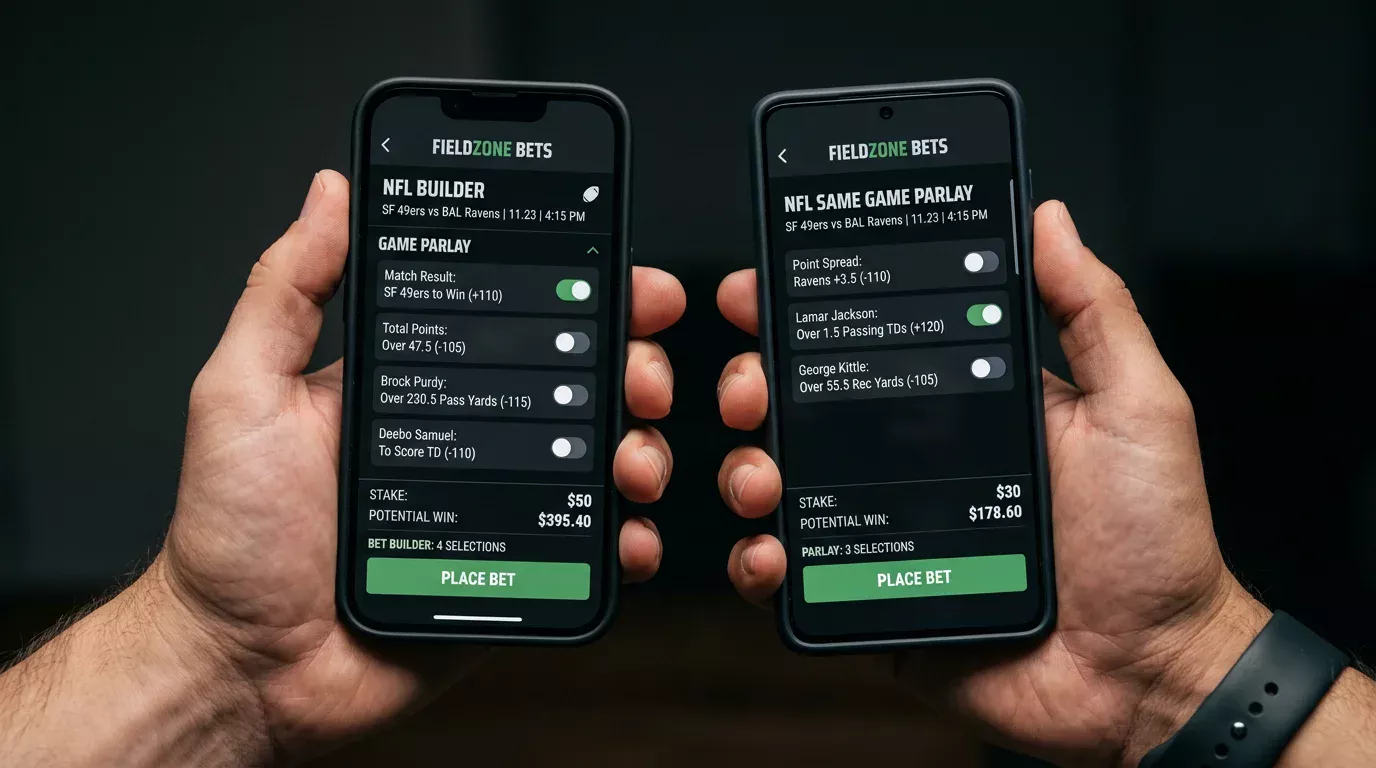
NFL Closing Line Value (CLV): The Single Metric That Predicts a Punter’s Long-Term Edge
 Available in US
The number I check before I look at my actual win rate
For my first three years betting NFL, I judged my season by one thing: how much I was up or down on the bottom line. That is the wrong number. I learned this the hard way after a season where I went 53-47 against the spread, which sounds great, and finished slightly down because my prices had been awful. The number that would have told me I was making good bets was closing line value, and I was not tracking it. After seven years now, CLV is the only metric I look at on a Sunday night to decide whether the week was good. The bottom line follows the CLV, not the other way around.
The break-even at standard −110 juice is 52.4%. A punter who consistently beats the closing line by half a point on NFL spreads will, given a long enough sample, sit comfortably above that line. The maths is unforgiving in both directions.
Understand the maths behind CLV in our NFL betting math, vig and CLV guide.
What closing line value actually means
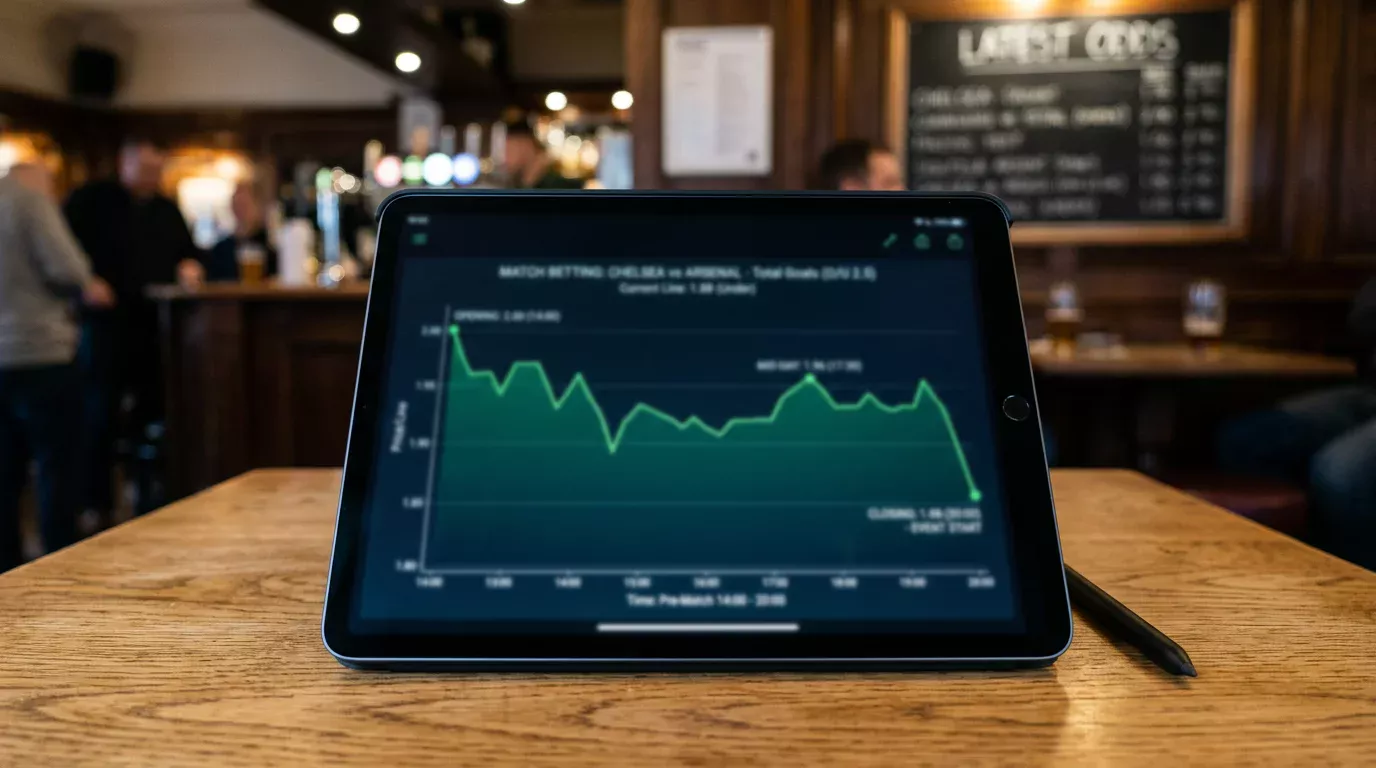
Closing line value is the difference between the price you got and the price the same market closed at, just before kick-off. If you took the Eagles +3.5 on Tuesday and the line closed at Eagles +3, you have positive CLV: you got a better number than the market consensus arrived at when all the information was in. If you took the Eagles +2.5 on Tuesday and the line closed at +3, you have negative CLV: you bought worse.
The metric matters because the closing line is the sharpest price the market will publish. Every minute leading up to kick-off, sharper money moves the line towards the true probability. By the time the whistle blows, the closing line is the best estimate the betting market has of what should happen. Beating that line, consistently, is the surest sign you are making bets the market thinks are mispriced – and being on the right side of mispriced markets is the only way to win long-term.
Why CLV predicts profit better than your current win rate
Win rate is noisy. Over fifty NFL bets, your win rate can swing eight or ten percentage points from one year to the next purely on variance. A 50% bettor and a 55% bettor often have indistinguishable records over fifty games. CLV is far less noisy. It is a per-bet measurement of price quality, not outcome, and it stabilises far faster than win rate does.
The empirical work on this is well-trodden. Bettors who consistently beat the closing line by a meaningful margin – even just half a point on NFL spreads – historically clear the 52.4% break-even threshold over large samples. Bettors who consistently lose to the close, even if they are winning short-term, regress to losing once the sample is large enough. Variance flatters bad CLV in the short run and punishes it in the long run.
Across recent industry surveys, 80% of NFL bettors keep accounts at two or more bookmakers. That habit is essentially a CLV-improvement strategy whether the punter realises it or not. The book offering you +3.5 when others are at +3 is giving you positive CLV before the bet has even settled.
Calculating CLV from fractional UK odds
UK punters get this wrong more often than they should, because fractional pricing makes the calculation feel harder than it is. The workflow is straightforward once you have done it twice.
Start by converting your fractional price to implied probability. A 10/11 price has an implied probability of 11 divided by 21, which is 52.4%. A 6/5 price has an implied probability of 5 divided by 11, which is 45.5%. The conversion formula is denominator divided by the sum of numerator and denominator. Do the same for the closing price. The difference between the two implied probabilities is your CLV in percentage points.
Example. You take the Bills moneyline at 6/5 on Tuesday morning. By Sunday, the closing price has shortened to 4/6, which is an implied probability of 60%. You bought at 45.5%, the market closed at 60%. You have positive CLV of 14.5 percentage points – a strong number. Even if the bet loses, the price you got was meaningfully better than the market consensus, and over many such bets that quality compounds. The companion guide to NFL bookmaker hold percentages across UK books covers how to strip the vig out of your closing prices so the comparison is apples-to-apples.
Building a CLV tracker that you will actually use
The best CLV tracker is the one you fill in. The fanciest spreadsheet does nothing if you stop logging bets after week three. The minimum viable tracker has six columns: date, market, side, price taken, closing price, and CLV. I keep mine in a plain Google Sheet with a column that calculates implied probability automatically using a single formula. Total weekly time spent on the tracker, in my case, is about fifteen minutes.
The thing to look at after a month of data is the median CLV across your bets, not the mean. The mean gets distorted by one or two massive moves on injury news. The median tells you what your typical bet looks like at close. A median CLV of plus half a percentage point on NFL spreads is a defensible long-term position. A median CLV of zero or negative means you are not beating the close, and your bottom-line wins so far are luck, not edge.
Explore nfl sports betting stats for edge-finding NFL tools.
The CLV mistakes I see most punters make
The most common error is treating CLV as a substitute for analysis rather than a check on it. Positive CLV is necessary for long-term profit; it is not sufficient on its own. A bettor who beats the close by half a point but stakes huge sums on poor-value spots will still go broke through variance. CLV tells you the bet was priced well. Bankroll discipline determines whether you survive long enough for the edge to play out.
The second mistake is comparing your price to the wrong close. Some punters compare to the close at the book where they bet. The cleaner reference is the market-consensus close – typically the line at the sharpest US book at kick-off, since that is the market with the most efficient pricing. Among NFL bettors aged 21 to 34, 60% place three or more bets a week, and the ones who track their CLV against a sharp reference book are the ones who quietly outperform the rest.
How do I calculate CLV when bookmakers quote fractional odds like 10/11?
Convert both your price and the closing price to implied probability using denominator over the sum of numerator and denominator. For 10/11 that gives 11 divided by 21, which is 52.4%. Do the same for the closing price and subtract – the difference, expressed in percentage points, is your CLV on that bet. Positive numbers mean you got a better price than the market eventually arrived at.
Is positive CLV proof I will profit long term on NFL betting?
It is the strongest available signal but not a guarantee. Positive CLV across a meaningful sample – say three hundred or more bets – is necessary for long-term profit because it shows you are consistently buying mispriced markets. It is not sufficient on its own: poor bankroll management or excessive stake sizing can still erode the edge through variance. CLV plus discipline equals long-term profit. CLV alone equals a strong indicator.
Published by the nfl Sports Betting Stats team.