NFL Touchdown Scorer Props: Anytime, First and 2+ TD Hit Rates Explained
 Available in US
Table of Contents
- The bet I see UK punters get wrong every single Sunday
- What the actual hit rate is on an anytime touchdown scorer
- First-touchdown-scorer pricing and why it varies so widely
- The 2+ touchdown prop and where it offers genuine value
- Red-zone share as the input that decides everything
- How a UK Bet Builder construction uses touchdown legs
The bet I see UK punters get wrong every single Sunday
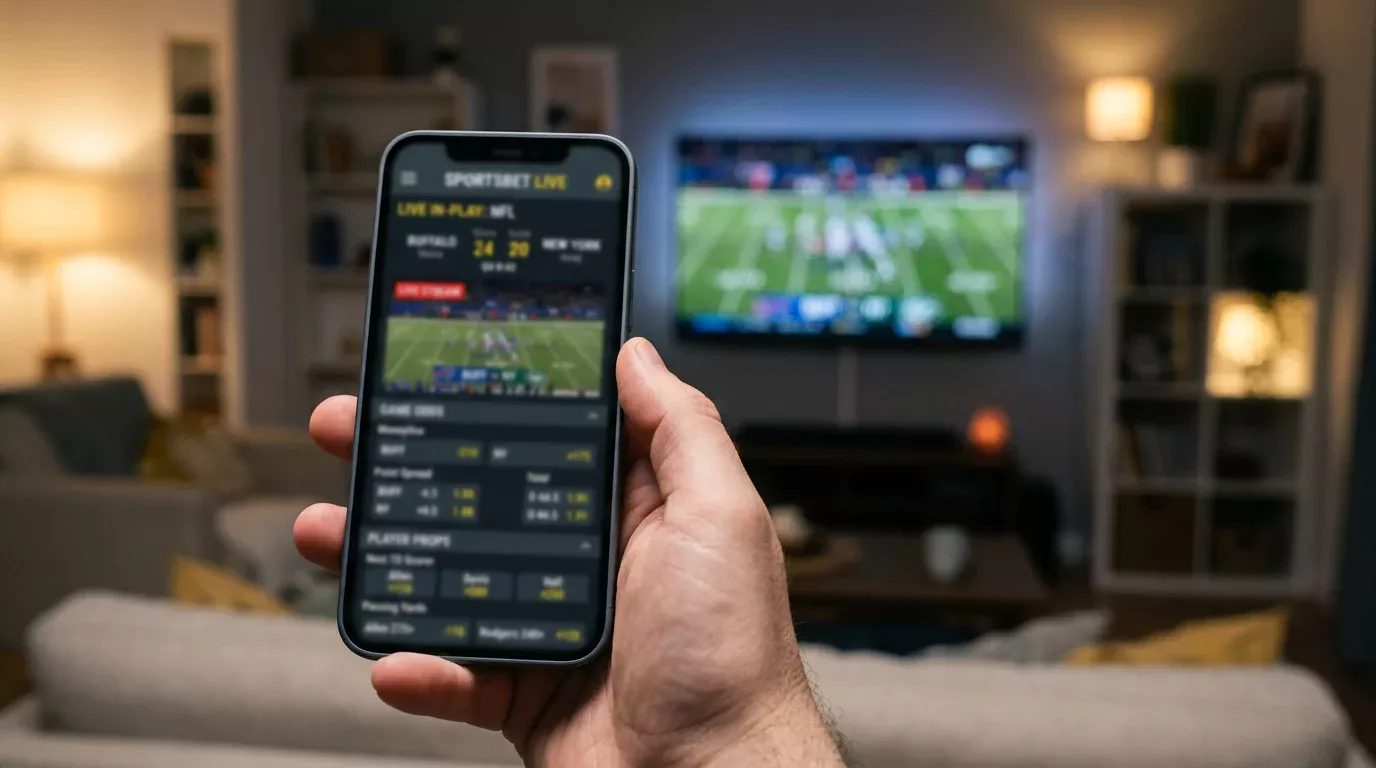
Every Sunday afternoon I watch UK punters in my WhatsApp group casually drop £20 stakes on first-touchdown-scorer markets at prices like 8/1, 10/1, 12/1. They treat it like a lottery ticket. The problem is that a first-touchdown-scorer bet has an actual hit rate, an actual fair price, and an actual hold percentage – and once you know those three numbers, the bet looks much less like a lottery and much more like a slot machine with a 25% house edge. Anytime touchdown scorer is a different animal. 2+ touchdown is a third one. Treating the three markets as variations of the same thing is how a UK punter spends a season slowly leaking money into the touchdown tree.
Optimove research shows that 60% of NFL bettors stake between £11 and £100 per wager, and touchdown-scorer props are one of the most heavily wagered prop categories in UK markets. The volume creates a structural inefficiency for the disciplined bettor and a structural drain for the casual one.
Identify targets with NFL QB passing props data for red zone connections.
What the actual hit rate is on an anytime touchdown scorer
The anytime-touchdown-scorer market settles when a named player scores at least one touchdown – rushing, receiving, or returning – at any point during the game. The hit rate on these bets depends entirely on the player you select. For a starting NFL running back averaging 18 touches per game with red-zone usage, the season-long anytime touchdown hit rate sits in the 55-65% range. For an alpha receiver with 25%-plus target share and consistent red-zone targets, the hit rate runs 35-45%. For role-player receivers or backup backs, it falls below 25%.
UK bookmakers price these markets at prices that, on the surface, look generous. A starting RB at 5/6 anytime might offer no value if his true hit rate is 56%, because the implied probability at 5/6 is 54.5%. A WR at 11/10 with a true 42% hit rate is reasonable but not generous. The hold on the touchdown market across all players in a game is typically 20-30%, which means most prices have a built-in margin that you need to identify before betting. Optimove insights identify NFL bettors aged 21 to 34 as the most active prop-betting demographic – with 60% placing three or more bets a week – and that demographic skews heavily toward anytime-touchdown bets on hyped offensive players.
First-touchdown-scorer pricing and why it varies so widely
The first-touchdown-scorer market is structurally different from anytime in one critical way: it has 30 or more runners. Every offensive player who could plausibly score is listed, and the prices have to sum to a total implied probability greater than 100% to account for the bookmaker’s hold. With that many runners, small variations in implied probability across the field create much wider price ranges than punters expect.
A starting running back might be priced at 7/1 first-TD on one UK book and 13/2 on another. That gap reflects two things: the bookmaker’s view of his red-zone usage and the bookmaker’s view of how the rest of the runners on the slate should be priced. Differences of half a point in fractional price across UK books on first-TD markets are common because the price-setting models differ on which secondary players should absorb the residual probability.
The hold on first-TD markets across all runners typically sits at 25-30%, which is the highest hold across any non-parlay NFL market. The breakdown of where that hold compounds and how it interacts with the mathematics behind anytime versus first-TD pricing is unpacked in detail in our companion piece on NFL anytime versus first touchdown scorer odds math. The honest takeaway is that first-TD markets are heavily juiced and require the bettor to find substantial mispricings to overcome the structural margin.
The 2+ touchdown prop and where it offers genuine value
2+ touchdown markets are an under-discussed corner of the touchdown tree. They settle when a named player scores two or more touchdowns in a game. The hit rate is much lower than anytime – typically 8-18% for starting backs with red-zone roles, 4-12% for alpha receivers. The prices are correspondingly longer: 6/1 to 10/1 for backs with consistent red-zone usage.
The structural inefficiency in 2+ TD markets is that bookmakers price them off historical multi-TD rates rather than off matchup-specific red-zone projections. A back facing a defence that has allowed multiple goal-line carries in five of the last seven games, on a team favoured to score 28-plus points, is in a structurally higher 2+ TD probability than the season-long average suggests. The market is slow to incorporate that matchup data because the volume on 2+ TD is lower than on anytime, which means lines move less aggressively.
The trade-off is variance. A 2+ TD prop at 7/1 with a true hit rate of 13% will resolve incorrectly the vast majority of the time. The bet only makes sense as part of a small-stake portfolio approach with at least 25-30 bets per season to give the edge time to compound.
Red-zone share as the input that decides everything
If I had to pick a single advanced metric that drives touchdown-scorer prop pricing, it would be red-zone share. The metric measures the percentage of a team’s red-zone touches – carries and targets inside the opponent’s 20-yard line – that go to a specific player. A back with a 65% red-zone touch share is in a structurally different probability bucket from a back with a 25% red-zone share, even if their overall snap counts are similar.
Red-zone share is a leading indicator for touchdown production in a way that overall snap counts and target shares are not. A receiver who runs the route and gets the target on third-and-goal from the 4 is a likely touchdown scorer. A receiver who runs the route on third-and-goal from the 18 is not. The granular red-zone usage data is published by the major analytics shops and refreshed each week. UK punters who incorporate it into their touchdown-scorer reads are operating with an information advantage over the punters who do not.
Visit nfl sports betting stats for NFL scoring markets.
How a UK Bet Builder construction uses touchdown legs
The Bet Builder products on Sky Bet and Paddy Power lean heavily on touchdown legs because they create combinable upside with positive correlation. A leg on “Eagles team total over 24.5” paired with “Saquon Barkley anytime touchdown” is structurally correlated – Barkley scoring tends to mean the Eagles are scoring – and the bookmaker’s pricing engine handles that correlation, usually in its favour.
The practical workflow for a UK punter looking to include touchdown legs in a Bet Builder is to use anytime markets, not first-TD markets, and to stack legs that are weakly correlated with the rest of the ticket. A bet that combines a spread leg with an anytime touchdown on a key red-zone player on the same team is a defensible construction. A bet that combines four anytime-touchdown legs across two different games is a structurally bad ticket because the correlation between the legs is essentially zero, the combined hit rate is very low, and the bookmaker’s hold compounds across each leg. The 0.5%-of-bankroll cap on multi-leg constructions applies here as everywhere – touchdown-scorer Bet Builders are entertainment, not value plays, and should be sized accordingly.
What is the typical hit rate on an ‘anytime touchdown scorer’ NFL prop?
It depends on the player. Starting NFL running backs averaging 18 touches per game with red-zone usage hit anytime touchdown at 55-65% over a season. Alpha receivers with 25%-plus target share and consistent red-zone targets hit at 35-45%. Role players and backup backs fall below 25%. The bookmaker’s price typically reflects most of this hit rate, with a 20-30% hold built into the market across all runners.
Why is first-touchdown-scorer pricing so wide across UK bookmakers?
Because first-TD markets have 30 or more runners and the bookmakers’ pricing models differ on how to distribute residual probability across secondary players. A starting back might be priced at 7/1 on one book and 13/2 on another because the books have different views on red-zone usage and on how the rest of the runners should be priced. The hold on first-TD markets sits at 25-30%, the highest of any non-parlay NFL market.
Created by the ”nfl Sports Betting Stats” editorial team.